- The Bitcoin Decay Channel provides long-term planning tools by mapping Bitcoin prices within historical bounds.
- Utilizes a regression model to apply exponential decay to price peaks, setting a decreasing trend for future highs.
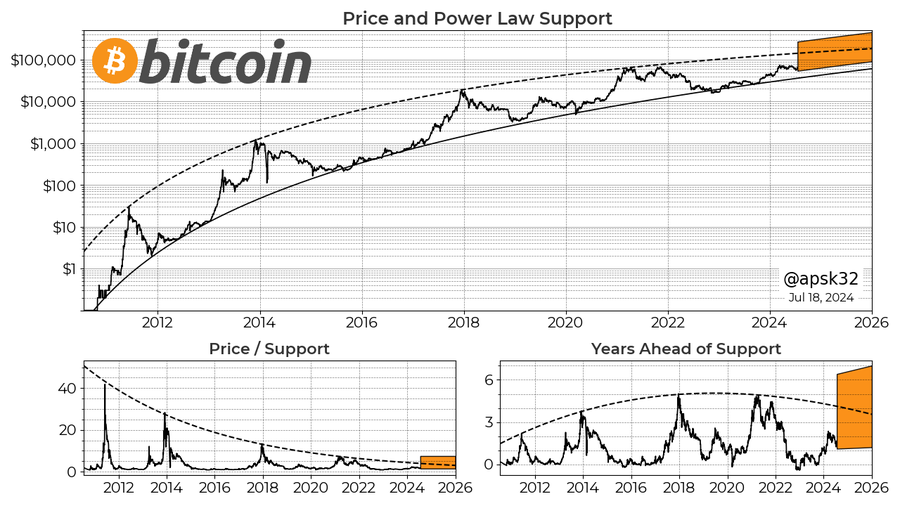
Recent data indicates that Bitcoin’s price-support ratio is following a pattern of exponential decay, which becomes evident when analyzing the peaks of this ratio over time. Historically, these peaks are becoming less pronounced, suggesting that the impact of each successive Bitcoin halving on the price may be diminishing.
A halving event, which occurs approximately every four years, reduces the reward for mining new blocks in half, thereby diminishing the rate at which new bitcoins are introduced to the system.

The model used to analyze these changes, expressed as exp(-5.31e-4 * t_d), where t_d is the time in days, provides a clear picture when converted into years. This conversion, calculated as 2^(-0.28 * t_y), closely aligns with Bitcoin’s halving events.

The “-0.28” factor in the exponent notably correlates with the frequency of these halving events, suggesting a direct relationship between these supply cuts and the price peaks.
Furthermore, this model predicts that if these trends continue, by the end of 2025, we could expect the years ahead of support (a measure of how far in advance the current price is above the power law support) to be approximately 3.55 at the cycle peak.
This is derived from the continuing pattern observed in the price-support relationship, which for investors looking to gauge future market conditions. The structured approach provides a clear visualization of potential future movements in Bitcoin’s price, projecting both the peak highs and the supportive lows.

The Decay Channel aims to correct common inaccuracies found in many speculative financial models, which often project unrealistically high tops due to optimistic biases.
This tool is designed to assist investors in making informed decisions based on a realistic assessment of how Bitcoin’s price might behave, considering both the historical trends and the mathematical likelihood of future price movements.
Analysis of the Bitcoin Decay Channel Chart

The chart “Bitcoin Decay Channel” presents a logarithmic scale of Bitcoin’s price (in USD) over time, spanning from 2011 to around 2033.
Here’s a detailed analysis:
Components of the Chart

Logarithmic Price Scale: The y-axis uses a logarithmic scale, which is crucial for visualizing the exponential growth and decay of Bitcoin’s price. This scale allows for a more comprehensive view of price movements across several orders of magnitude.

Decay Channel: The chart includes two major trend lines forming a channel:

- Upper Green Line: This represents the upper boundary of Bitcoin’s price growth.
- Lower Yellow Line: This represents the lower boundary or support level of Bitcoin’s price.
The upper bound of the price channel, often depicted as a straight line in log-log space, does not accurately follow a power law. This traditional visualization suggests a constant proportional change, which does not align with the actual behavior of Bitcoin’s highest price levels.
These levels deviate towards an exponential model, indicated by a curved line in log-log space. Various versions of these channels, including “Open,” “Narrowing,” and “Decay,” aim to provide a more accurate representation, preventing overestimations of Bitcoin’s future value that can result from assuming a power law.
Adjusting Bitcoin Price Predictions for TradFi Influences and Historical Data Weighting
When conducting a linear regression analysis on Bitcoin’s price peaks, excluding the initial peak due to non-equilibrium conditions and focusing on the subsequent peaks (2 and 3), yields a modified projection. Assigning equal weight to the 2013 data point, similarly to those from 2017 and 2021, may not provide an accurate reflection of market dynamics, considering the differing market conditions and investor behavior in those years.

Moreover, with the increasing infusion of traditional finance (TradFi) capital into the cryptocurrency market, it is anticipated that the underlying behavioral economics driving market movements will evolve.

This influx is likely to alter the historical pricing patterns and could significantly influence future price trajectories, necessitating adjustments in predictive modeling strategies to accommodate these shifts.
The post Utilizing Historical Data: Bitcoin Decay Channel’s Approach to Predicting Price Movements appeared first on ETHNews.
