
- Ethereum is forming a bullish bull flag pattern and could surge above $3,600 if it breaks key resistance levels and reclaims the Gaussian Channel midline.
Ethereum is once again on traders and market watcher’s cross-hairs as the digital asset flashes potential bullish signs that could see the asset rally by a massive 90%. With ETH currently consolidating in a bullish pattern and reclaiming a key technical indicator, analysts are speculating whether the asset is primed for a parabolic move above $3,600.
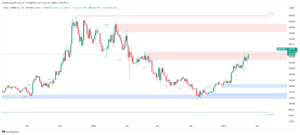
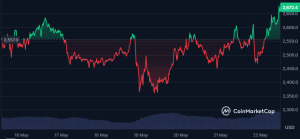
At the time of writing, ETH is swapping hands with $2,667.30 after a 5.40% surge in the past 24 hours. Notably, ETH’s price action is forming a classic bull flag on the daily chart. This pattern typically signals a continuation of an upward trend, emerging after a strong price rally.

In this case, from $1,900 to $2,730. The current consolidation between $2,400 and $2,750 creates the “flag,” and if ETH breaks above $2,600, it could target the $3,600 mark, calculated by adding the flagpole height to the breakout level.

Key resistance lies in the $3,000–$3,100 zone, while the 200-day exponential moving average (EMA) provides support near the lower end of the range. The relative strength index (RSI) has also cooled from overbought conditions, potentially resetting Ethereum for another push upward.
What’s especially capturing attention is ETH’s recent interaction with the Gaussian Channel, a two-week technical indicator that adapts to market volatility to highlight trend direction.

Notably, Ethereum is attempting to reclaim the channel’s midline, a move that, if successful, has historically triggered explosive rallies. Notably, ETH soared 93% to $4,000 after reclaiming this level in 2023 and saw a staggering 1,820% surge during the 2020 breakout.
Still, this signal isn’t foolproof. A similar setup in August 2022 was invalidated due to a broader market correction. Yet the potential upside has traders watching closely.
Adding to the bullish narrative is the emergence of a golden cross between the 50-day and 200-day simple moving averages (SMA) on the 12-hour chart. Although not as reliable as the daily timeframe, this crossover is often interpreted as a precursor to strong bullish momentum.
Despite these technical tailwinds, caution remains warranted. Crypto trader XO warns that ETH is consolidating beneath significant resistance around $2,800 and could enter a “range-bound environment” for weeks if it fails to break out soon. Cointelegraph also notes that ETH has been rejected near the key Fibonacci retracement levels between 0.5 and 0.618, a possible signal of short-term weakness.
Into a decent level of resistance here
First significant rally since the extended sell off from mid december.
Should we get a corrective move then I’m leaning towards price carving out a range bound environment for at least several weeks potentially longer, and once… pic.twitter.com/ejgALCpcm3
— XO (@Trader_XO) May 20, 2025
Should Ethereum fail to maintain momentum, support levels lie near $2,150 and $1,900—zones that could temporarily halt any bearish correction.
While Ethereum’s recent price action and overlooked Gaussian Channel signal hint at a possible parabolic rally, market participants should stay alert to both upside potential and downside risks. A successful breakout above $2,800 and sustained hold above the Gaussian midline could mark the start of ETH’s next major leg up.

The post Is Ethereum About to Go Parabolic? Traders Eye This Overlooked Signal appeared first on ETHNews.