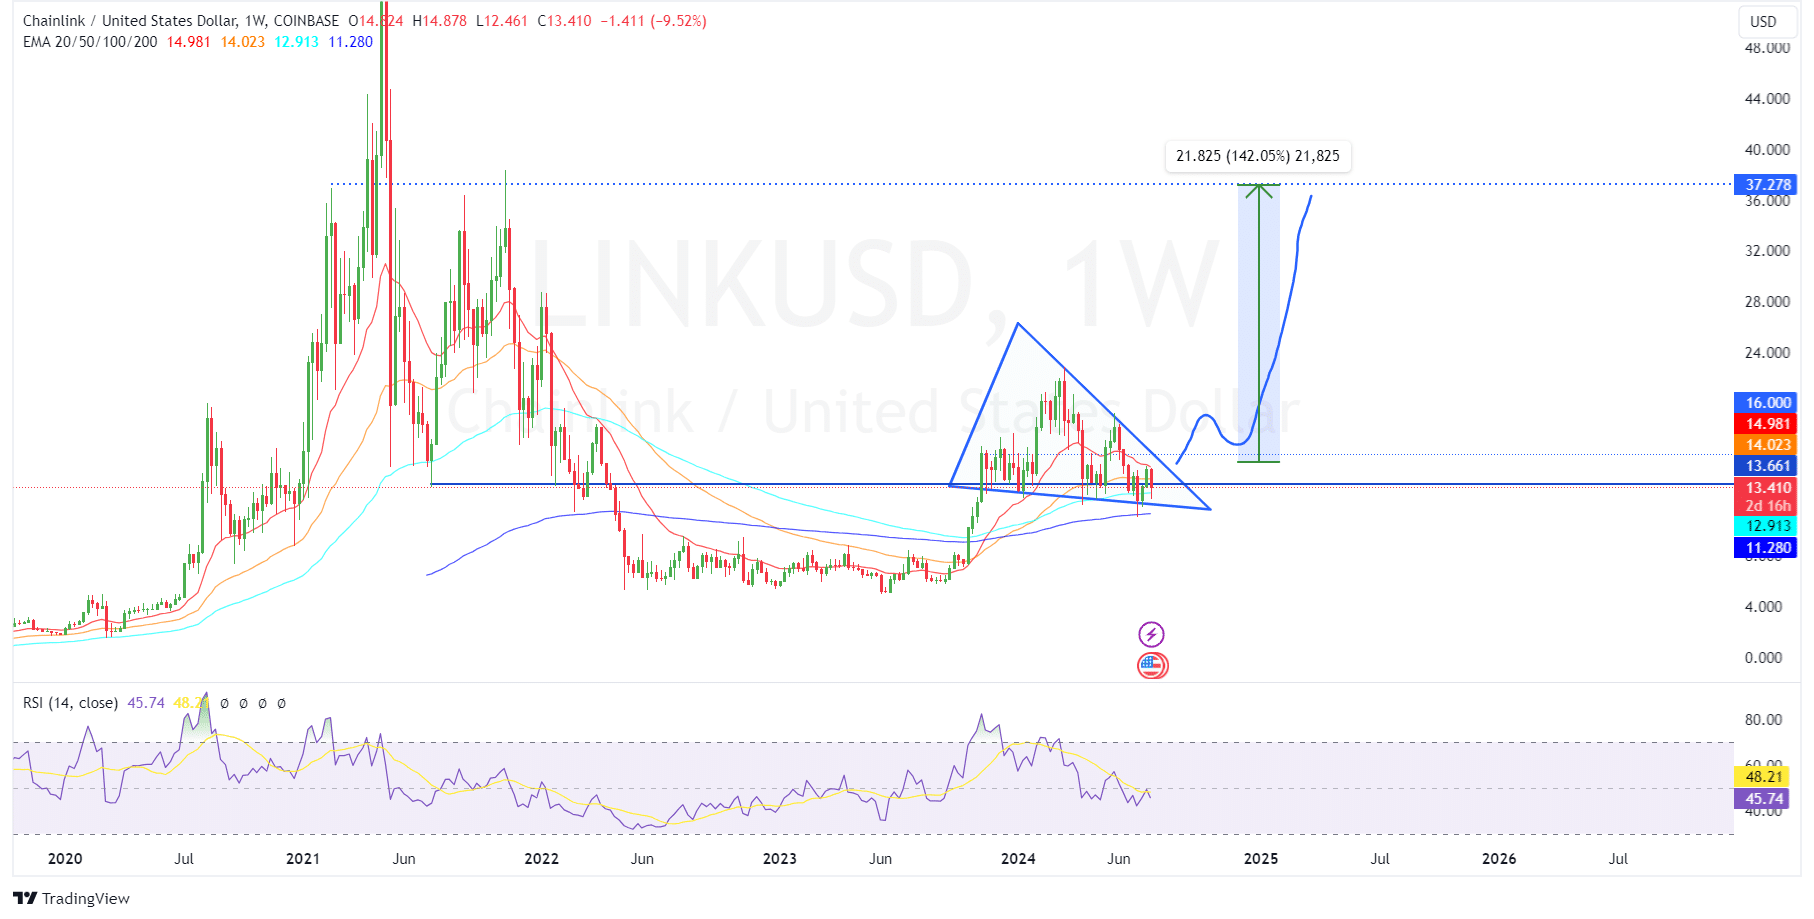
- Chainlink trades at $13.42, showing a 3.07% increase, amidst forming a symmetrical triangle pattern on weekly charts.
- Analysts predict a potential rally for LINK, with a breakout above $16 possibly pushing prices up to $37.278.
Chainlink (LINK) is currently witnessing a pattern that could potentially set the stage for a substantial increase in its value. Trading at $13.42, LINK has shown a modest rise of 3.07% over the last 24 hours, according to ETHNews.
This activity takes place within a symmetrical triangle pattern identified on the weekly charts, suggesting that LINK could be on the verge of a bullish movement.
This pattern, which began forming between the high of $22.87 on March 11 and the low of $11.01 on July 1, indicates a consolidation phase that is typically followed by a significant price movement. Analysts, including Ali on X, note that the TD Sequential has signaled a buy on the 4-hour chart, adding to the positive outlook for LINK.
The TD Sequential presents a buy signal on the #Chainlink $LINK 4-hour chart! pic.twitter.com/dlh9SH0HUf
— Ali (@ali_charts) July 25, 2024

If LINK breaks through the critical resistance level of $16.00, it could trigger a rally of up to 143%, potentially pushing the price to approximately $37.278.

Such a surge would not only reflect growing market confidence in Chainlink but also a robust interest in its technological capabilities.

Technical Analysis and Market Indicators
LINK has encountered persistent resistance at $13.66 through the first and second quarters, with the price correcting back to the support trendline at $12.08. Recently, LINK rebounded from this support, climbing to its current level and aligning with key moving averages, including EMA 20/50/100/200.

Holding these levels could see LINK increase by 27.6%, aiming to retest the weekly resistance at $16.22.
The Relative Strength Index (RSI) and Awesome Oscillator (AO) on the daily charts currently show LINK just below the neutral 50 mark. For a recovery rally to gain momentum, these indicators need to maintain above their average levels.
Considerations and Risks
Despite the optimistic scenario, there is a downside risk. If LINK’s price closes below $11.04 on the weekly chart, it would negate the bullish pattern and could lead to a significant drop, potentially reducing its value by 60.9% to as low as $4.996, reflecting its weekly lows from June 19, 2023.

The network activity on Chainlink has been relatively stable, with notable spikes in active addresses and transaction volume around April 8, 2024, which later returned to normal levels, indicating a temporary increase in user engagement.
The post Chainlink Poised for Potential Breakout as Market Eyes $37 Price Target appeared first on ETHNews.


