- Ethereum’s price recently surged over $2,800 but is now showing signs of weakness, currently trading at $2,742.
- Trading volume decline by 18% and a Relative Strength Index at 42 indicate increasing selling pressure on Ethereum.
Ethereum’s price trajectory has been a topic of interest as it briefly surged above $2,800 but has since shown signs of faltering, hovering around $2,742. This fluctuation comes amidst a broader cryptocurrency market rally, raising questions about the stability and future movements of ETH prices.

— Whale Alert (@whale_alert) August 26, 2024
Recent trading activities reveal a downturn in Ethereum’s market strength. Trading volumes for Ethereum have decreased by 18%, indicating a reduced buying activity which may not sufficiently support the recent price gains.


This is mirrored in Ethereum’s Relative Strength Index (RSI), currently at 42, which suggests that selling pressure is mounting as the market sees an increase in sellers. The RSI trends further indicate a potential weakening of the upward momentum.

Adding to the bearish outlook, the Directional Movement Indicators (DMI) affirm that bears might be gaining the upper hand.
The negative directional indicator (-DI) surpasses the positive one (+DI), underscoring a bearish trend. Nonetheless, the Average Directional Index (ADX) stands at 14, suggesting that while the market is leaning towards a bearish sentiment, the trend’s strength remains low.
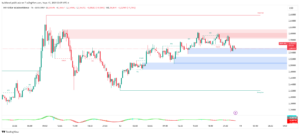
Fibonacci Retracement and Price Support
As I had already reported in an analysis on ETHNews, the bearish sentiment might prompt Ethereum’s price to test the 0% Fibonacci retracement level at $2,718 soon. A failure to maintain this level could set the stage for further declines, testing lower support thresholds.
Contrastingly, Ethereum’s exchange reserves have hit a record low, as noted by CryptoQuant. This implies that fewer investors are keeping their ETH on exchanges, potentially reducing immediate selling pressure. This might ordinarily suggest a bullish scenario but the current market indicators tell a different story.
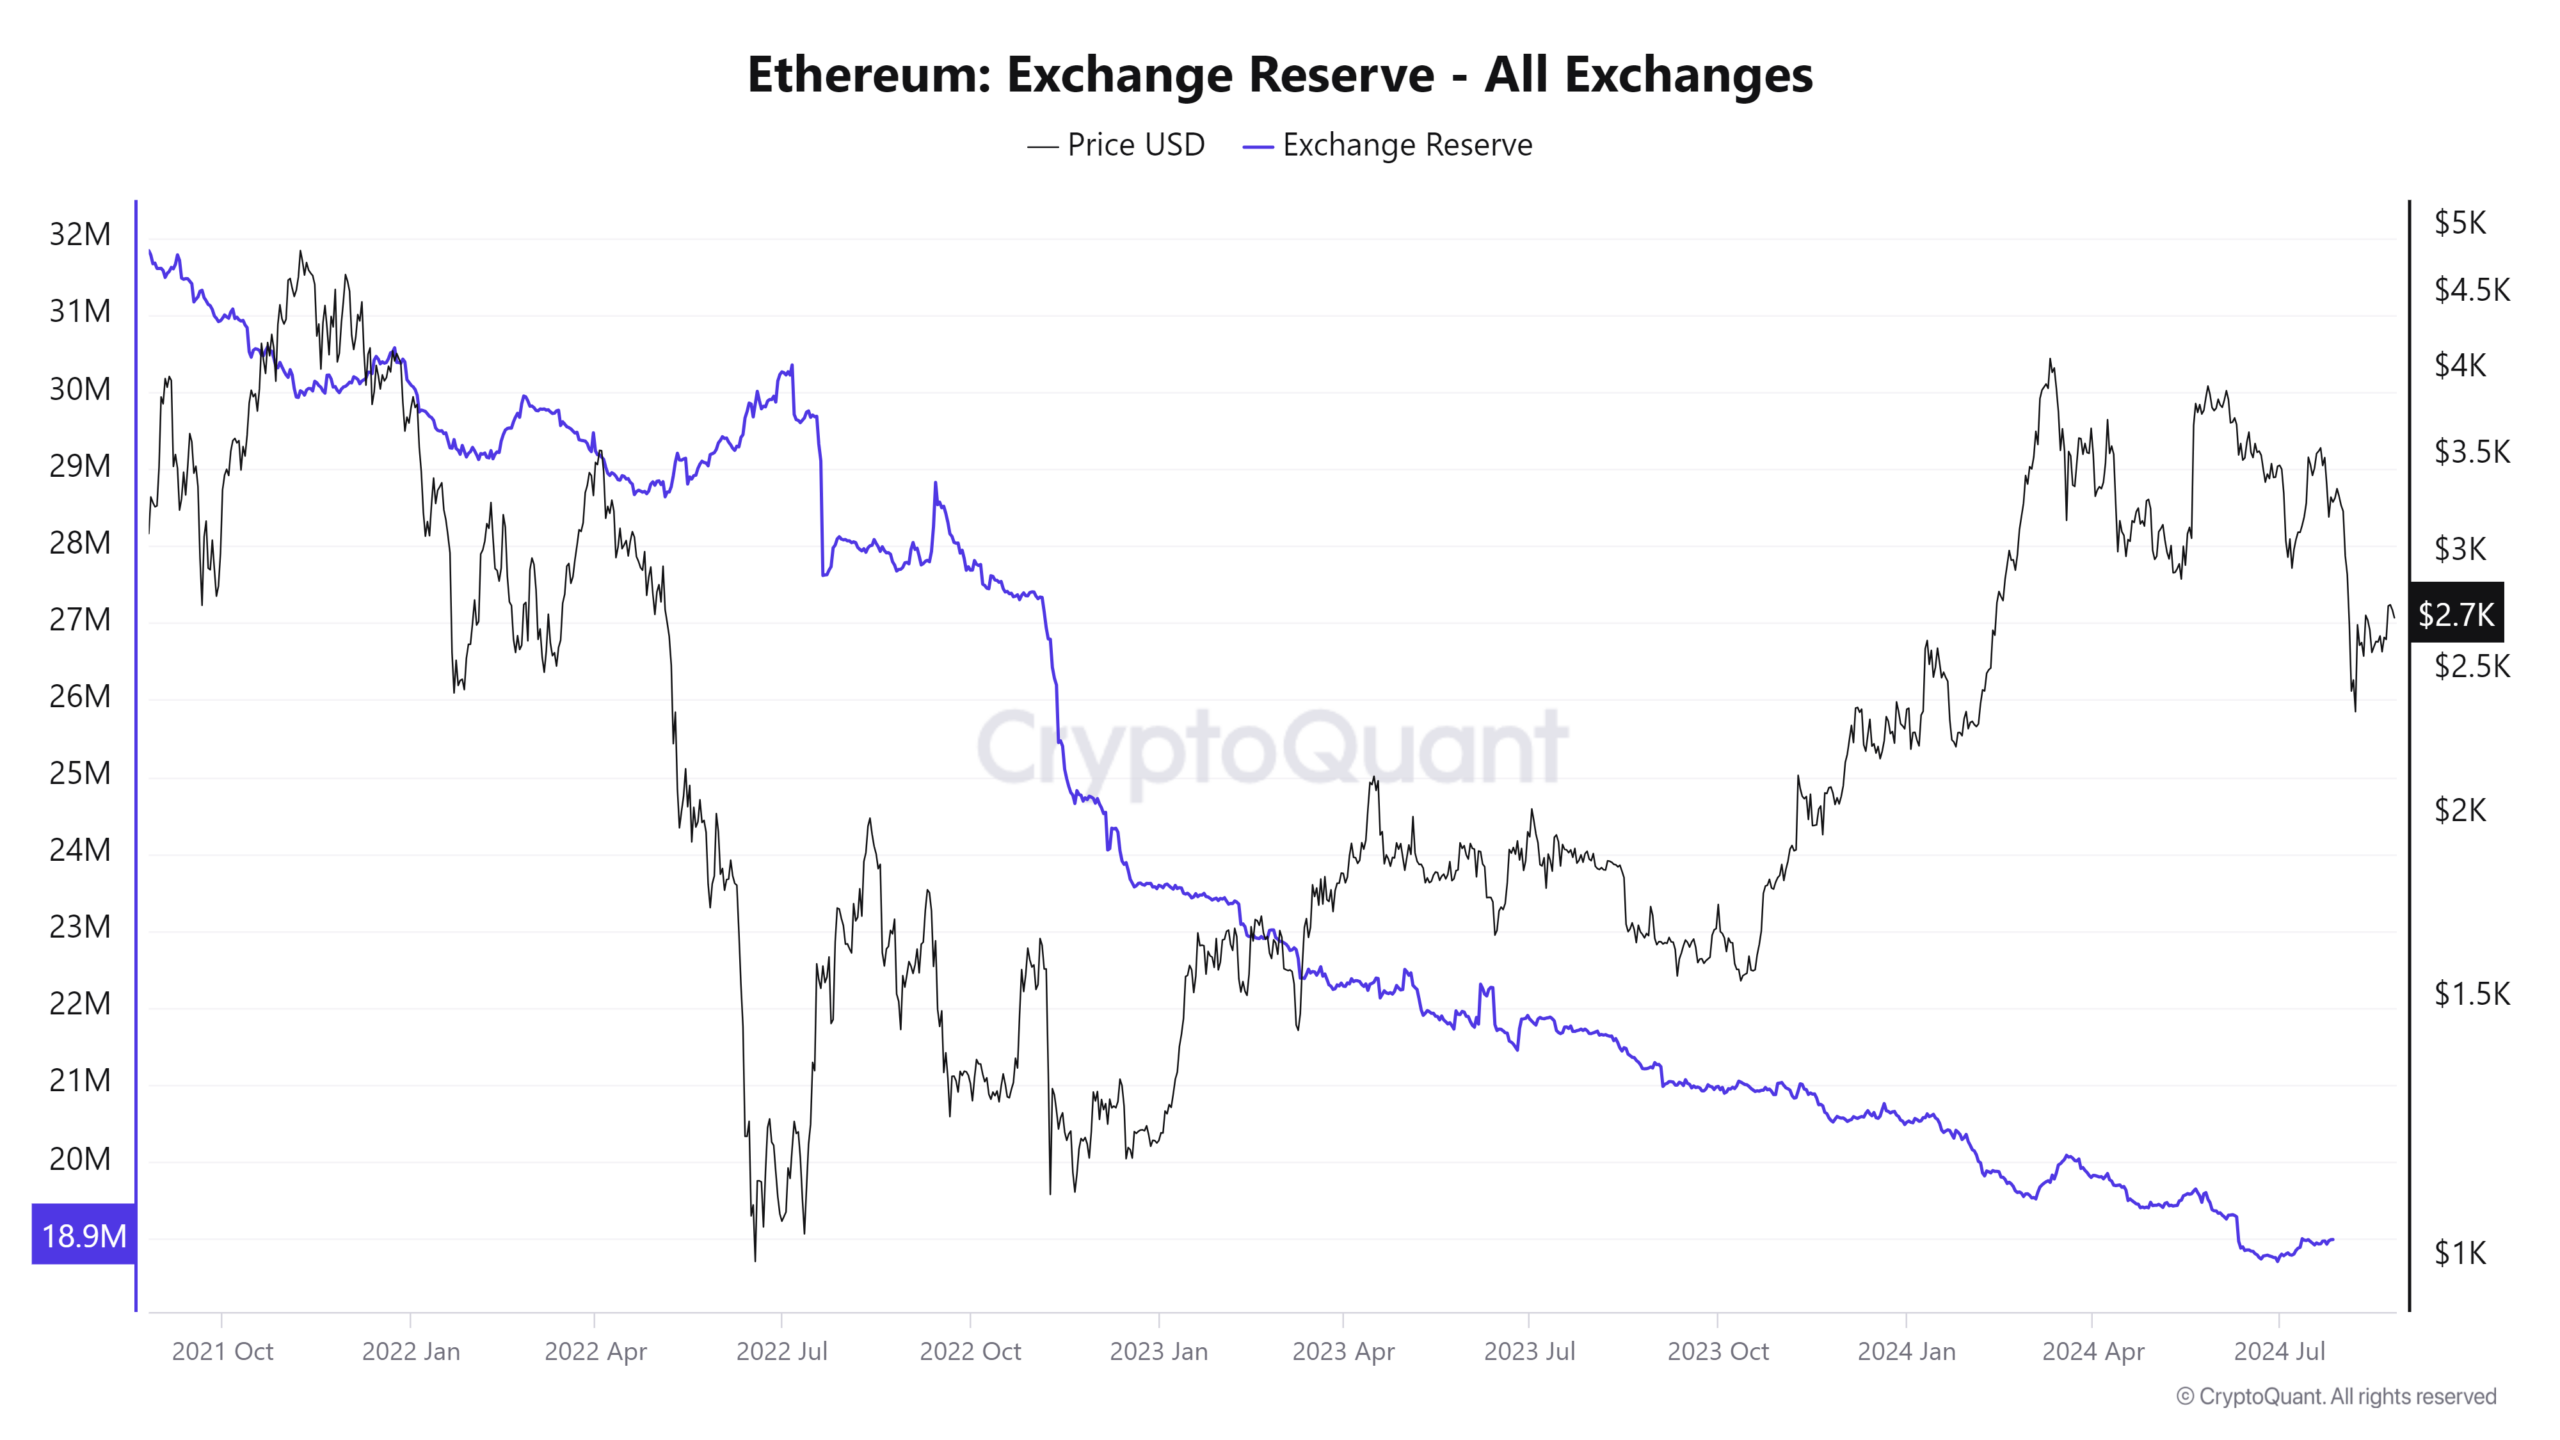
The drop in the Ethereum exchange supply ratio this month suggests a reluctance among traders to sell at current levels, possibly expecting future gains or not finding the current price sufficiently enticing to liquidate holdings.
Open Interest and Market Expectations

Despite the low exchange reserves, Ethereum’s open interest has rebounded from below $10 billion to over $11.5 billion. This recovery in open interest is coupled with a long/short ratio of 0.92, indicating a slight dominance of short positions in the market.

This could mean that a significant number of traders are anticipating a further drop in ETH prices in the near term.
The current price of ETH (Ethereum) is $2,716.4 USD, with a decrease of 1.17% in the last 24 hours.
Here’s a technical analysis based on the latest market data:
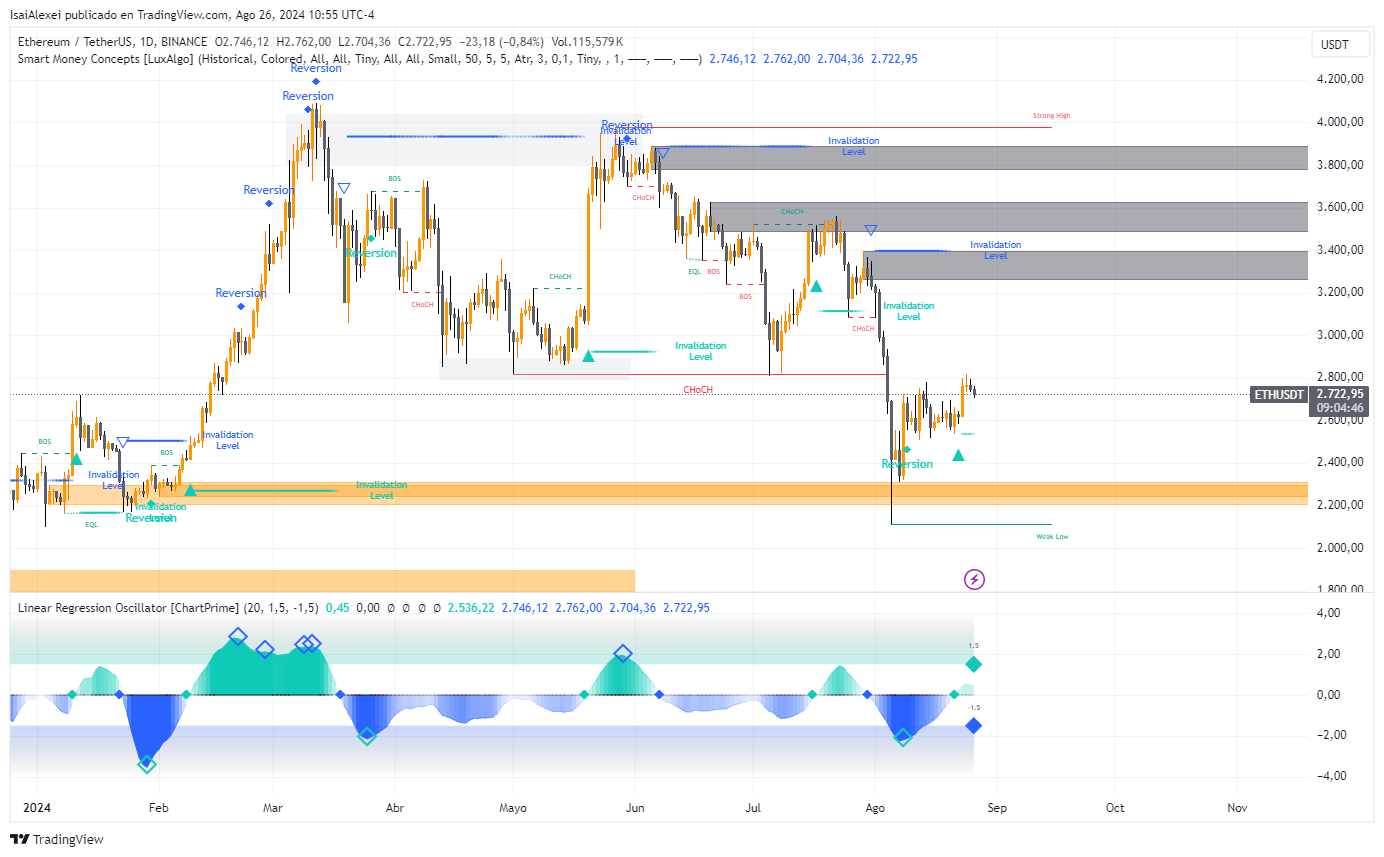
Price Trend: Ethereum has experienced a decline of 17.04% over the past month, reflecting a bearish trend. However, it still shows a year-to-date increase of 19.06%, indicating some overall upward momentum in the longer term.
Potential Scenarios
- Bullish Case: If ETH can break above the $2,854 resistance, it could target higher levels around $2,900 or even $3,000, especially if market sentiment remains favorable.
- Bearish Case: A failure to hold the support around $2,535 could lead to further declines, potentially testing lower levels around $2,490.
The post Could Ethereum’s Plunge Below $2,800 Signal the End of the Bull Run? appeared first on ETHNews.