- U.S. spot Ethereum ETFs saw $265.4M outflows over seven days, marking 17 consecutive days of withdrawals amid institutional risk aversion.
- Ethereum’s DEX volume fell 30% this week; TVL dropped 47% since January, led by Lido and Maker declines.
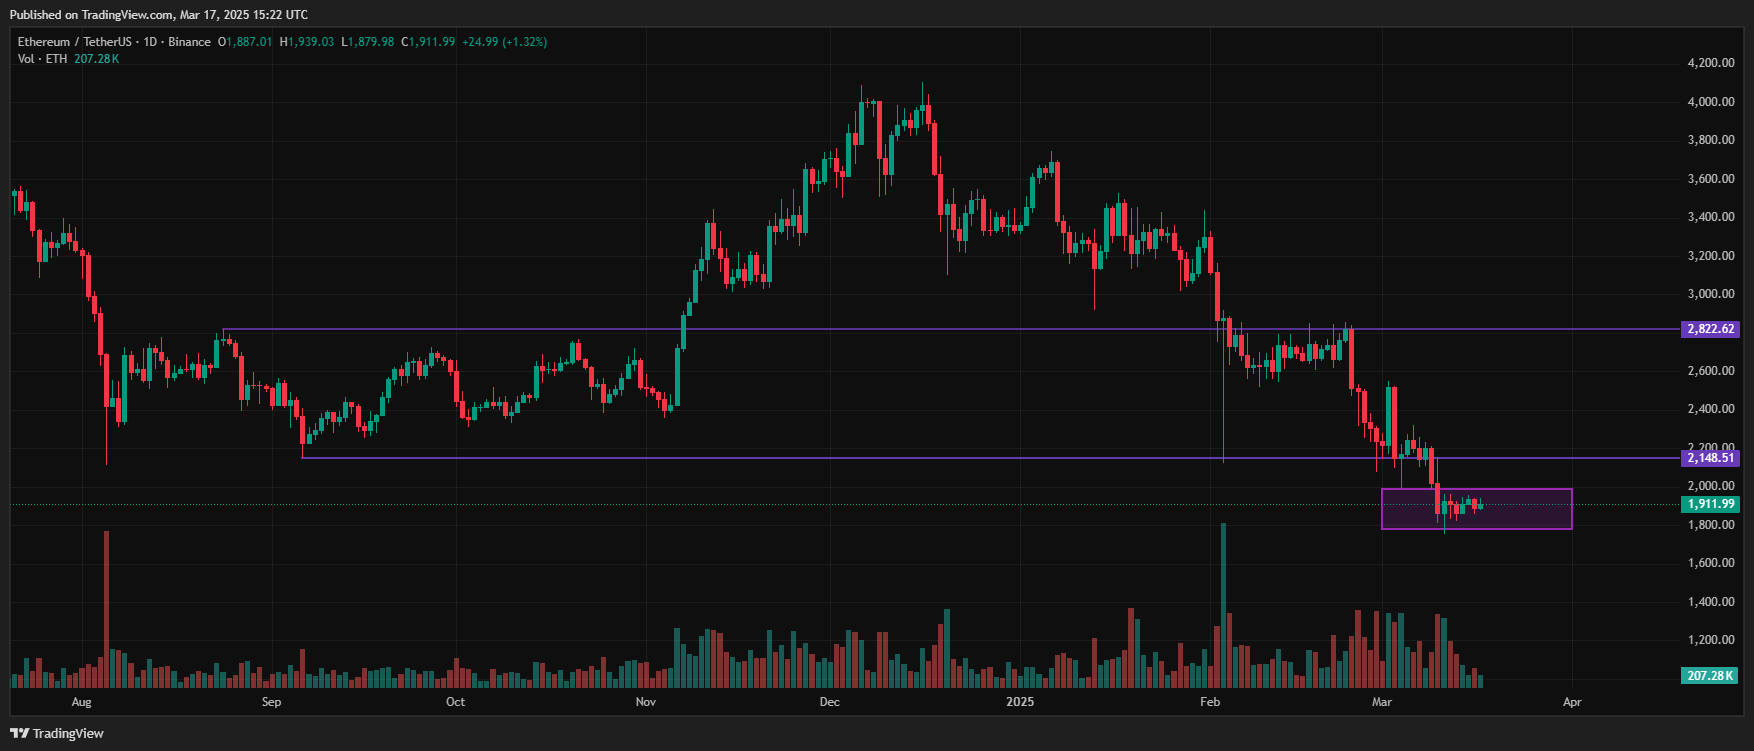
Ethereum (ETH) has traded between $1,810 and $1,960 over the past seven days, according to data from ETHNews.


The $2,000 resistance level remains a key barrier, with bearish pressures from ETF outflows, declining on-chain activity, and negative technical signals limiting upward momentum.
Spot ETF Outflows Highlight Institutional Caution
U.S.-based spot Ethereum ETFs recorded $265.4 million in outflows last week, per SoSoValue. Additional institutional products saw $176 million withdrawn, bringing March’s total outflows to $265 million.

CoinShares’ James Butterfill noted this marks the worst monthly outflow streak since 2015, with 17 consecutive days of withdrawals. These movements underscore persistent risk aversion among institutional investors.
On-Chain Metrics Reflect Reduced Activity
Ethereum’s seven-day decentralized exchange (DEX) volume fell 30% to $16.8 billion by March 17. Key protocols like Maverick and Dodo saw volumes drop 85% and 45%, respectively.

Meanwhile, Ethereum’s total value locked (TVL) declined 9.3% this month, down 47% from January’s peak of $77 billion to $46.37 billion as of March 11.

Major protocols, including Lido (-30% TVL), EigenLayer (-30%), and Maker (-28%), contributed to the downturn.
Bear Flag Pattern Signals Downside Risk
A bear flag pattern has appeared on Ether’s four-hour chart, suggesting a potential drop to $1,530 if the price breaks below the $1,880 support level. The pattern, characterized by a downward-sloping channel, projects a 20% decline from current levels upon confirmation.

The Relative Strength Index (RSI) sits at 48, favoring bearish momentum. Bulls must push ETH above the 50-period simple moving average (SMA) near $1,930 to defend the $1,880 support. Invalidating the bear flag requires a close above $1,970.

While the $1,880 support offers short-term stability, sustained outflows, shrinking on-chain activity, and weak technical indicators tilt market sentiment toward caution. ETH ability to reclaim key resistance levels or confirm deeper corrections will hinge on shifts in institutional flows and on-chain demand.

As of today, Ethereum (ETH) is trading at $1,907.15, reflecting a 0.98% increase in the past 24 hours. Over the past week, ETH has dropped by 5.69%, and in the last month, it has declined 30.10%. Additionally, Ethereum has seen a 45.87% decrease over the past year, indicating sustained bearish momentum in the market.
Ethereum’s all-time high was $4,868.00 on November 10, 2021, while its lowest recorded price was $81.79 on December 15, 2018. Currently, technical indicators signal a sell trend, with both daily and weekly analysis pointing toward further bearish sentiment. The key support levels to monitor are $1,850-$1,800, while resistance remains around $2,000-$2,050.
The post ETH Struggles Below $2K as ETF Outflows, On-Chain Decline Weigh on Price appeared first on ETHNews.


