
- Sui’s May DEX volume hit $14.8B, far exceeding its historical monthly average of $3.93B significantly.
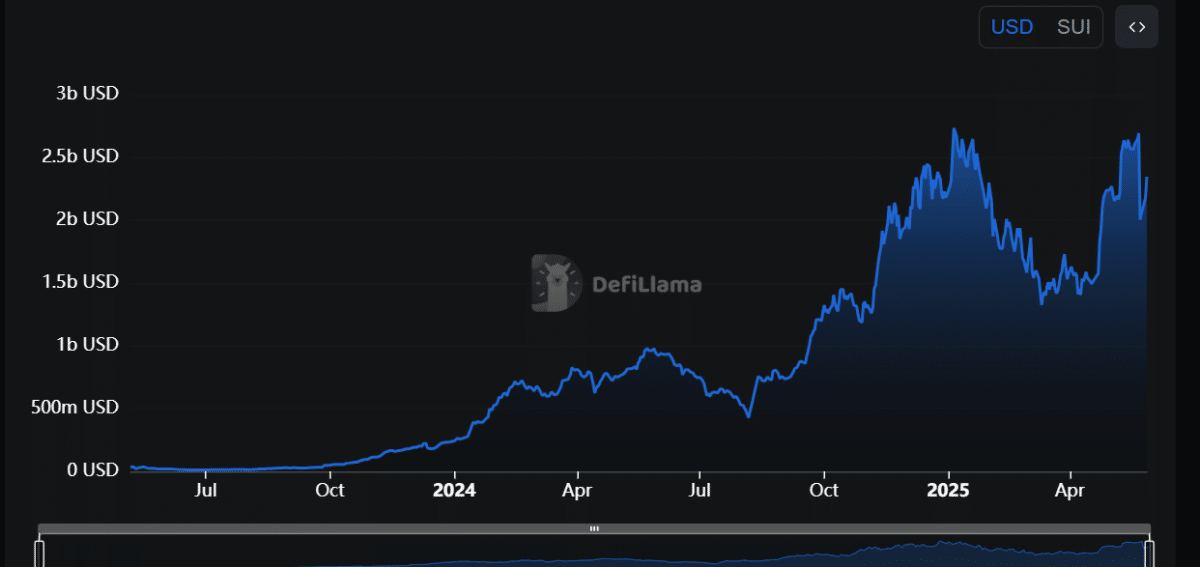
- TVL rose 7.69% to $2.346B; net $1.31M inflows indicate accumulation during price consolidation periods.
The Sui blockchain recorded $14.8 billion in decentralized exchange trading volume during May 2025. This figure represents the highest monthly volume since the network’s launch. It substantially exceeds the chain’s typical monthly average of $3.93 billion. Concurrently, capital committed to Sui’s decentralized finance protocols increased. The total value locked (TVL) reached $2.346 billion, rising 7.69% within a single day.

Network data indicates funds moved into Sui-based applications exceeded outflows slightly. Over a recent period, $54.92 million entered these protocols. During the same timeframe, $53.61 million exited. This resulted in a net positive movement of $1.31 million into the ecosystem.
Key Price Hurdle Remains Firm
Despite these network usage gains, the SUI token struggles to surpass $3.87. ETHNews analysis of trading data identifies a concentration of potential automatic sell orders between $3.60 and $3.87.

This zone contains many positions betting the price will fall. Markets often move toward these liquidity clusters like a nervous system responding to stimuli. A decisive break above $3.87 could force these sellers to exit rapidly, possibly pushing the price toward $4.97.

Technical indicators currently show limited upward momentum strength. The Moving Average Convergence Divergence (MACD) suggests near-term upside potential appears constrained. If SUI fails to overcome the $3.87 barrier, the price could decline toward $3.57 or potentially $3.12. Observers now assess whether the strong usage and capital growth can overcome this technical resistance.

SUI trades at approximately $3.67 per unit. Its 24-hour trading volume exceeds $1.08 billion. The market capitalization stands near $12.27 billion, which places it around the 11th spot globally, according to recent data from CoinMarketCap.
Over the past 24 hours, the price has dipped by 0.81%. In comparison with the weekly high of $4.20, SUI is down close to 13%. Therefore, the token appears to be in a short-term correction phase.

During 2025, SUI’s lowest point was $1.73, and it reached $5.35 on January 6. Its average closing price this year is about $3.61. Consequently, the current level sits near the year-to-date average, suggesting a temporary balance between buyers and sellers.

The 14-day Relative Strength Index (RSI) reads around 50.38, which indicates neither side holds a clear advantage. Meanwhile, the 100-day Exponential Moving Average (EMA) rests near $3.28.

On the four-hour chart, SUI recently tested resistance between $3.75 and $3.80. If it breaks this barrier, the price may attempt an upward move. However, a retreat below $3.50 could send it toward the next support level at $3.20.
The Fear and Greed Index sits at 71, signaling a level of greed. Yet only 40 % of the last 30 days showed gains.

This means buying and selling pressures remain fairly matched. If SUI closes consistently below the 100-day EMA, the bearish trend may strengthen. In contrast, a surge in trading volume over the coming sessions could help the price recover.
The post Sui Network Hits Record Trading Volume Amid Price Resistance appeared first on ETHNews.
